9. Next Stop
Graphic Design, Data Visualization, Research
How are densification, gentrification and access to the rest of the city related to the placement of transit stations? This data visualization research highlights the relationship of Seattle’s ever-expanding light rail with the changing demographics of station neighborhoods. In a rapidly growing city, such as Seattle, what effects does the introduction of a transit station have on the surrounding network?
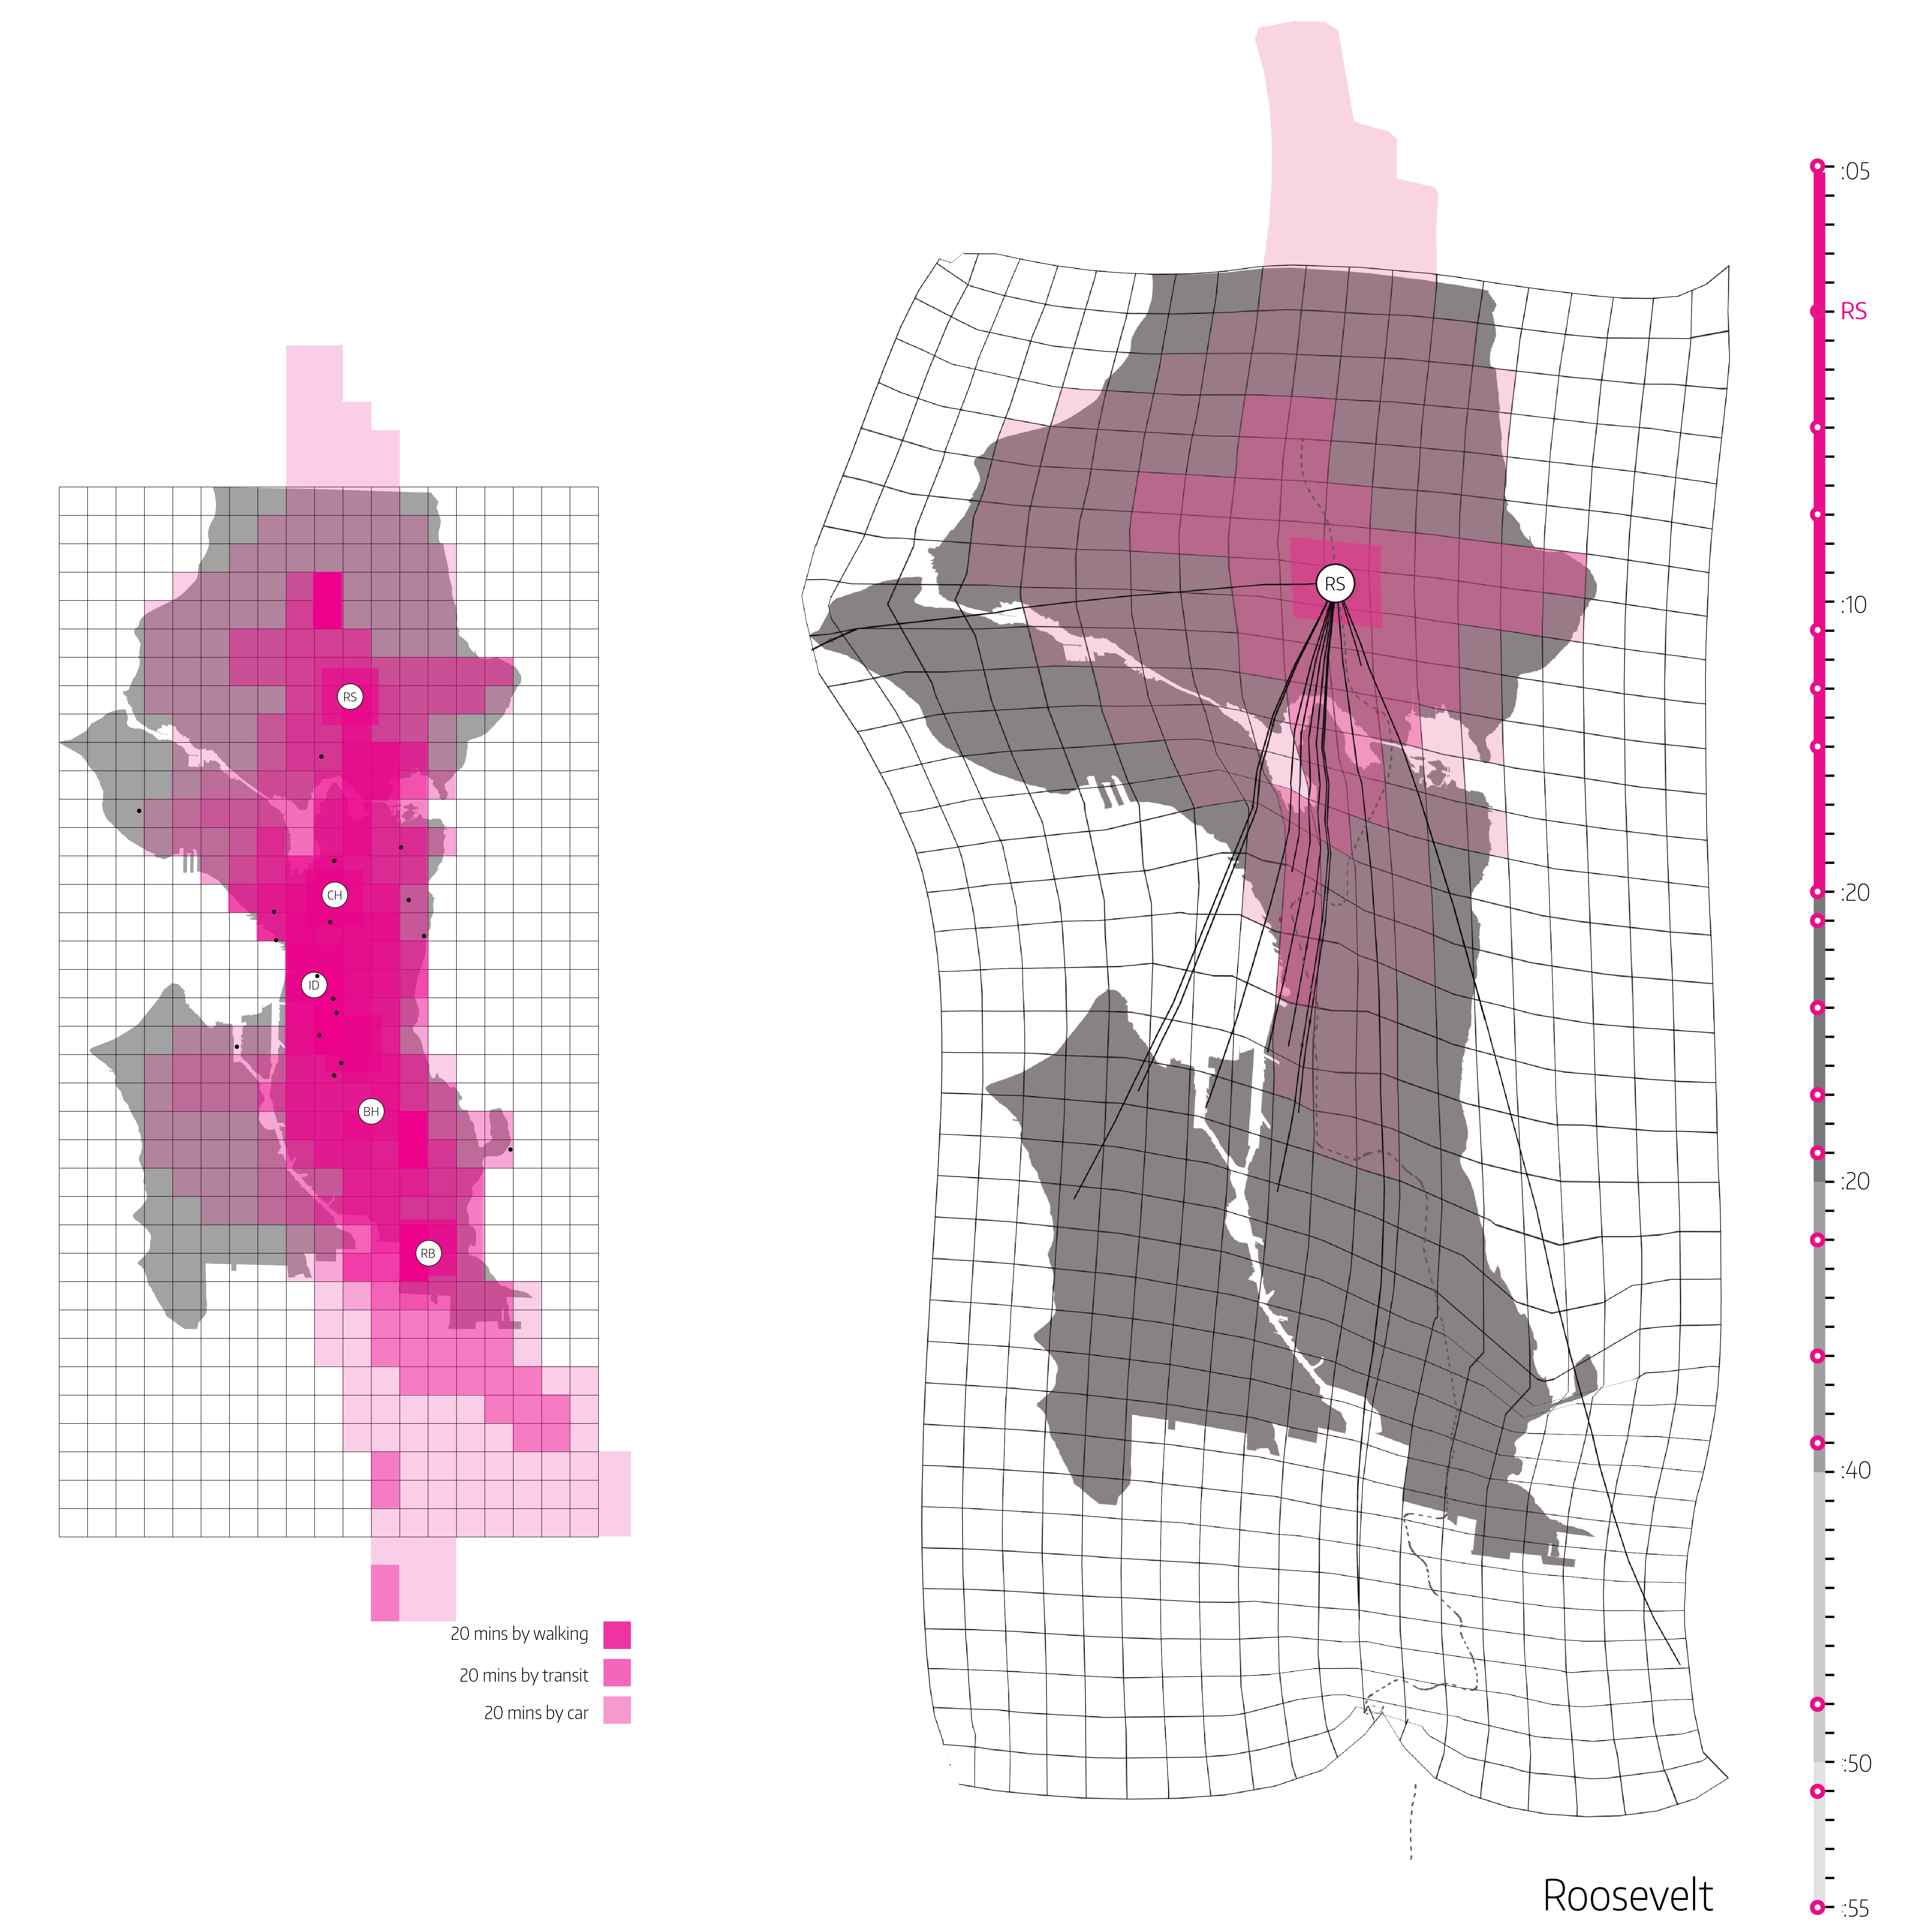
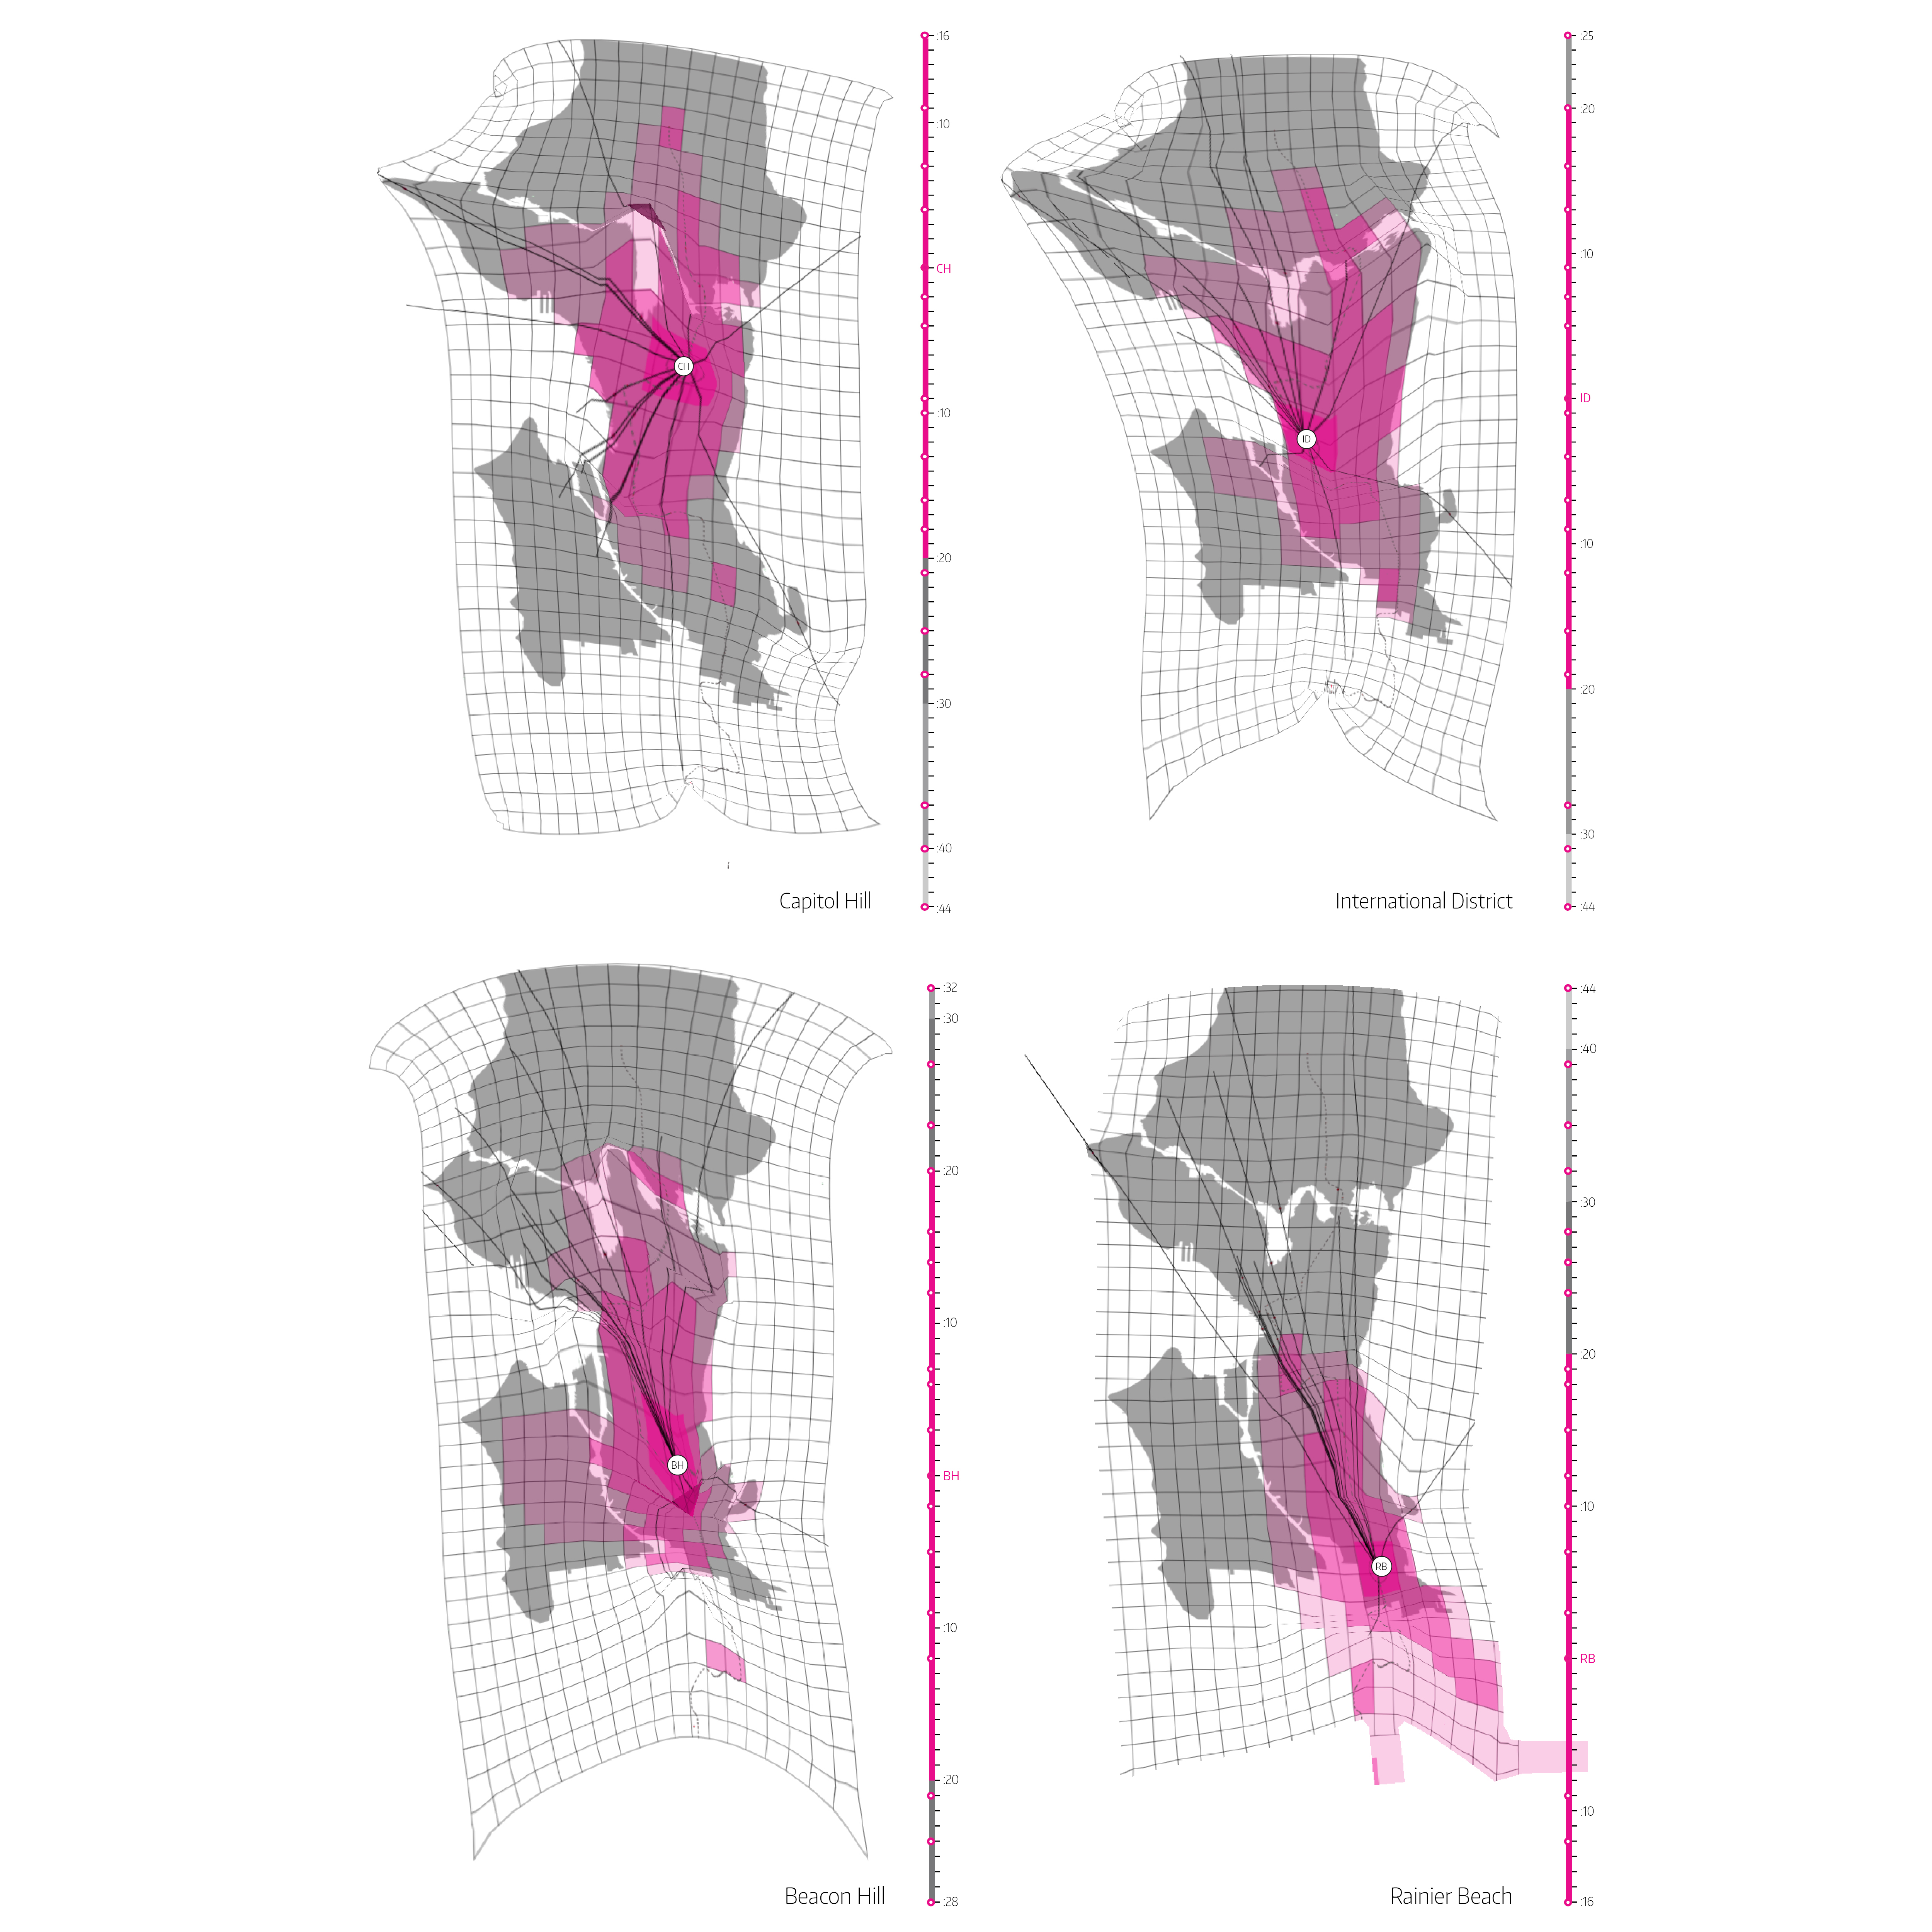
Qualitative and quantitative variables provided a more comprehensive narrative of the station and the neighborhood it altered. Time and distance from stations to popular city destinations were used to demonstrate how access and availability can alter one’s perception of a city based on location.
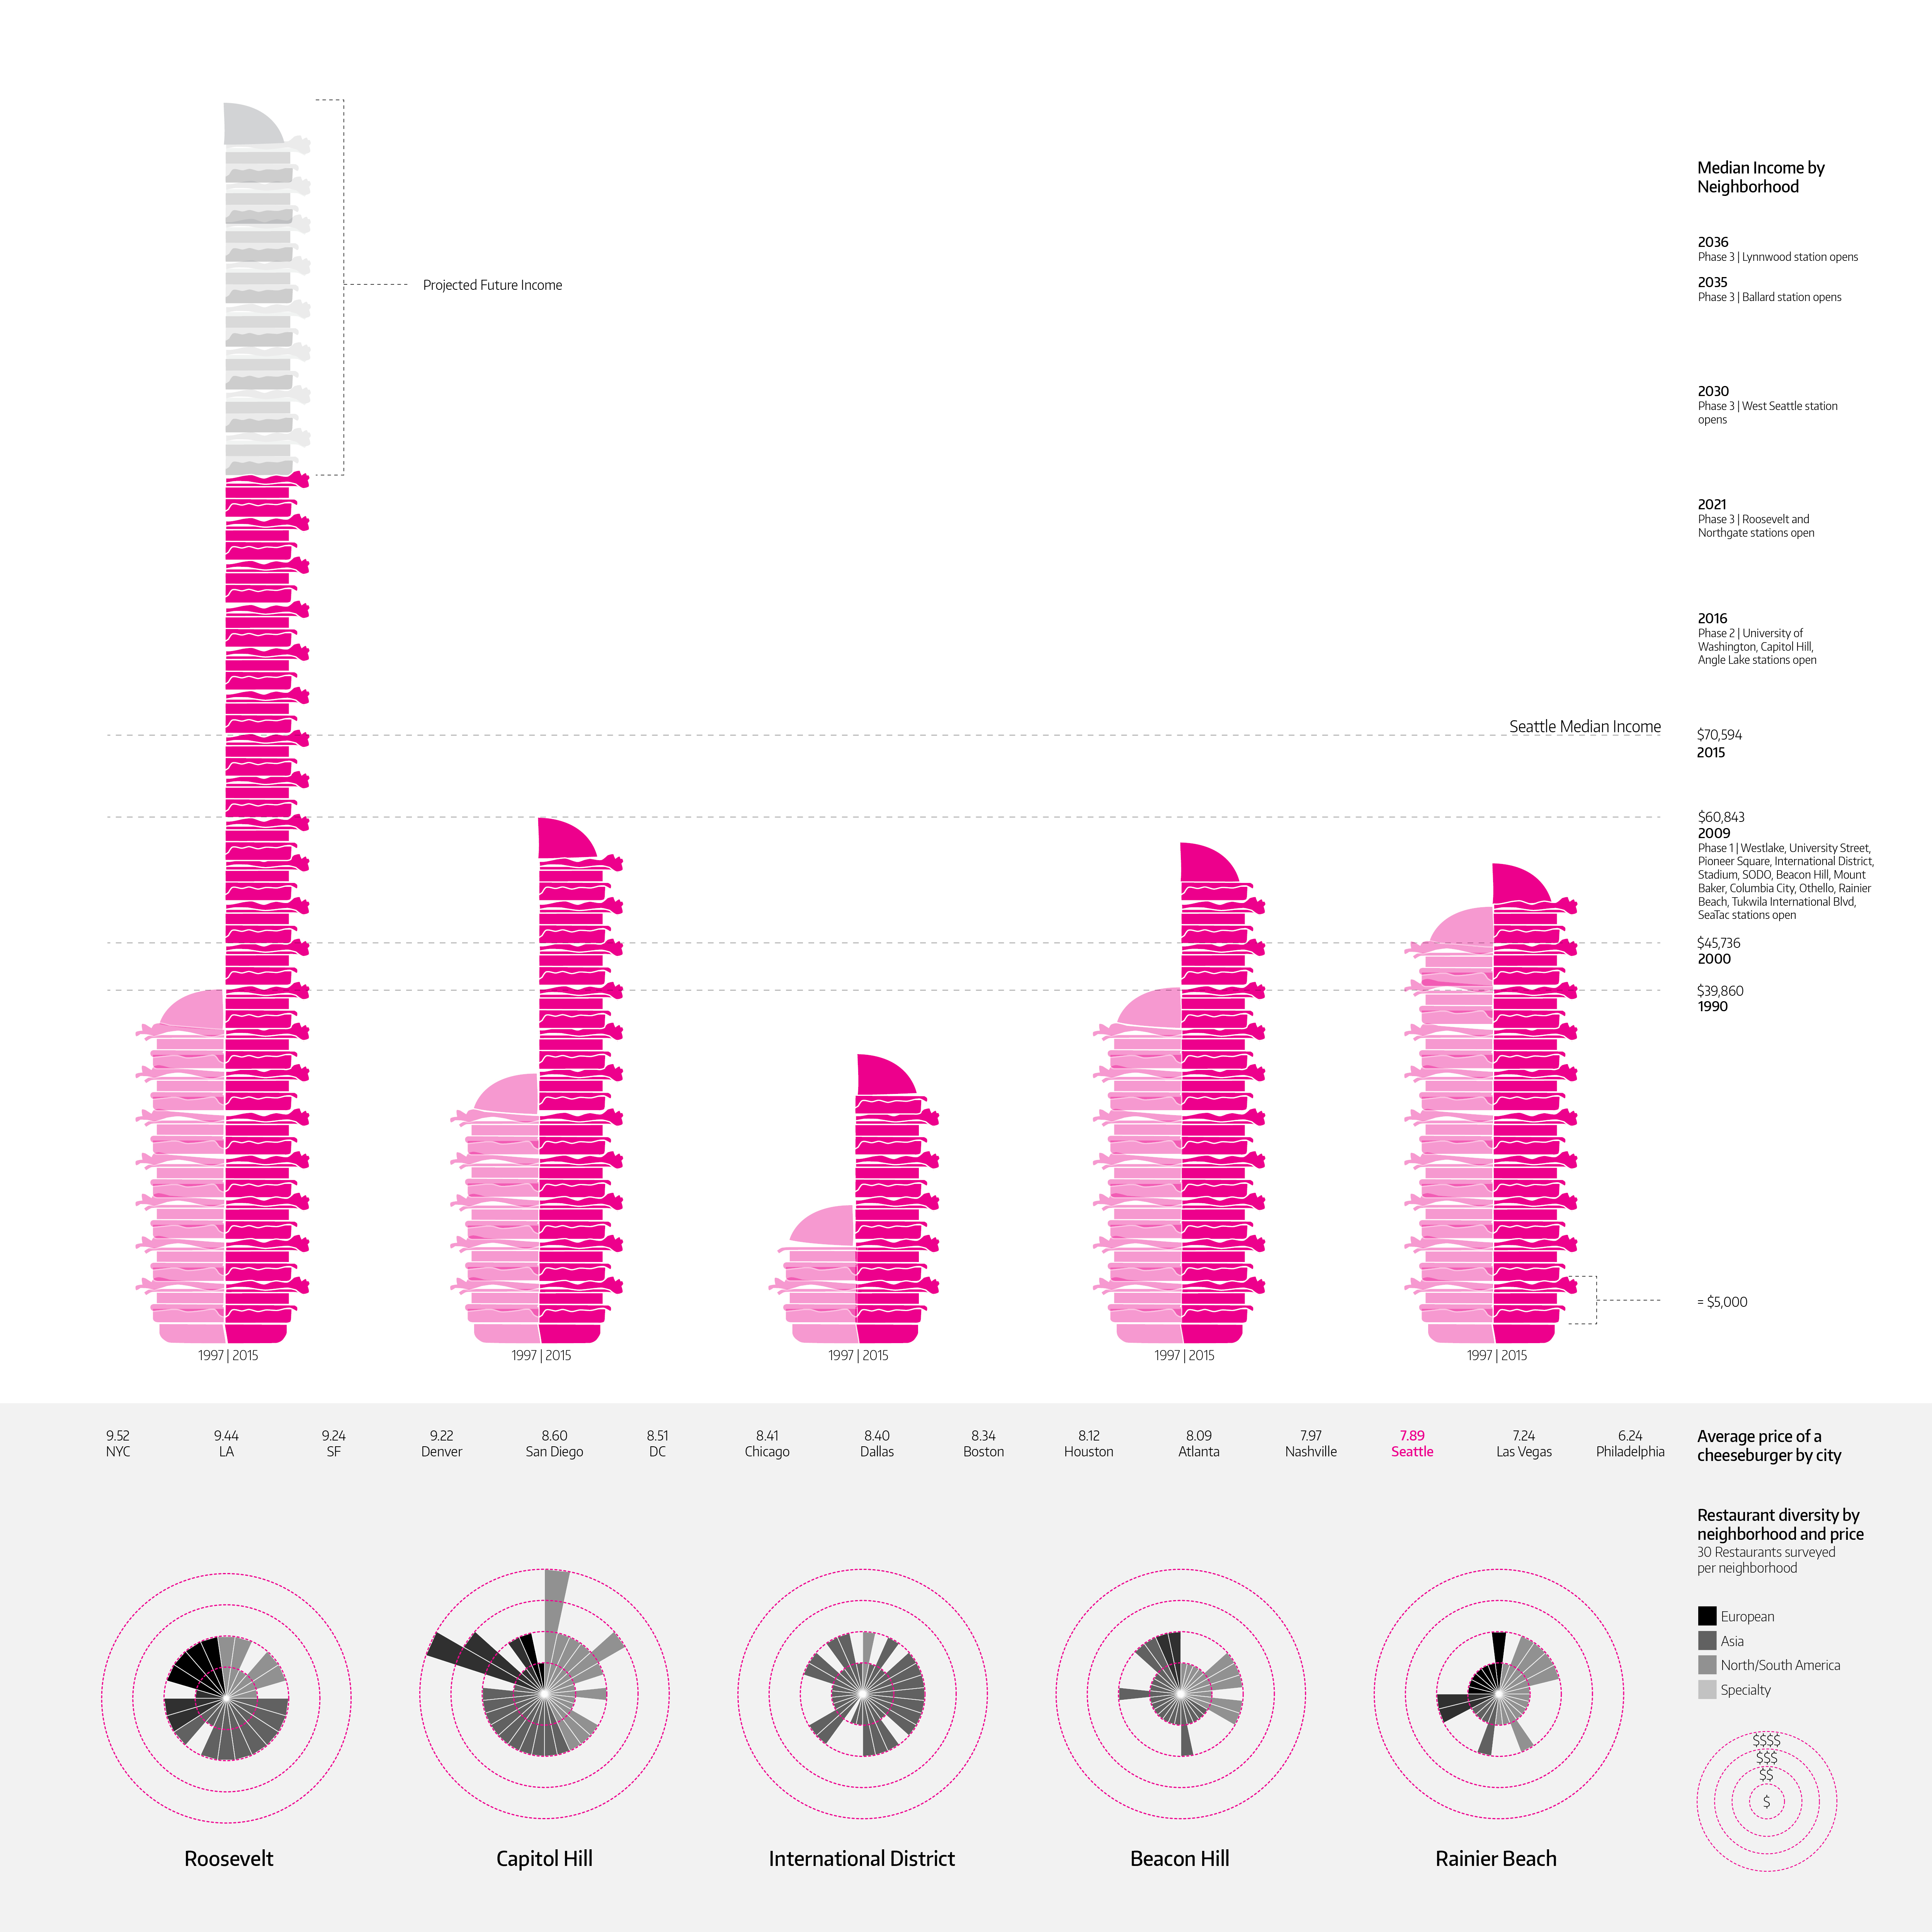
Household income and education backgrounds from each station neighborhood were compared with the ethnic diversity among neighborhood restaurants to highlight gentrification and diminishing diversity. Burgers were used to highlight household income, as a nod to The Big Mac index by The Economist and so I had an excuse to eat some burgers.

Collaborators: Everardo Lopez & Jesslyn Howard